A real distance to grid on every candidate site.
Substations, transmission lines and their corridors mapped from high-res imagery, so each site in your file carries a routed connection distance instead of a ruler line.
The files
- Deliverable
- Distance layer
- Format
- GIS layer (GeoPackage or shapefile)
- What's in it
- For each candidate site, the nearest visible substation and the nearest visible transmission line, each with a route distance in miles. One record per site, keyed to your site IDs. Delivered once per annual pass.
- Cadence
- Annual pass
- Deliverable
- Corridor route
- Format
- Line layer
- What's in it
- A plausible routed path from each site to its nearest substation, drawn with terrain and major obstacles in view (water, highways, steep ground). It follows existing corridors where it can. Open it in your desktop GIS beside your parcel and constraint layers.
- Cadence
- Annual pass
- Deliverable
- Region map
- Format
- GIS layer
- What's in it
- Every substation and transmission line the imagery shows across your candidate set or region, so you can see the neighbourhood around a site and not only its nearest node.
- Cadence
- Annual pass
- Deliverable
- Site table
- Format
- CSV
- What's in it
- One row per site: site ID, nearest substation, route distance, straight-line distance for comparison, and a visibility note where the imagery was poor. Paste it into the pipeline tracker.
- Cadence
- Annual pass
How it works
- In
Sites in
You send candidate sites as points or polygons, or name a region. Say which are in the pilot.
- Pass
Annual pass
We take a high-res satellite pass over the pilot area at 0.5–2 m, timed to your screening calendar.
- Detect
Detect
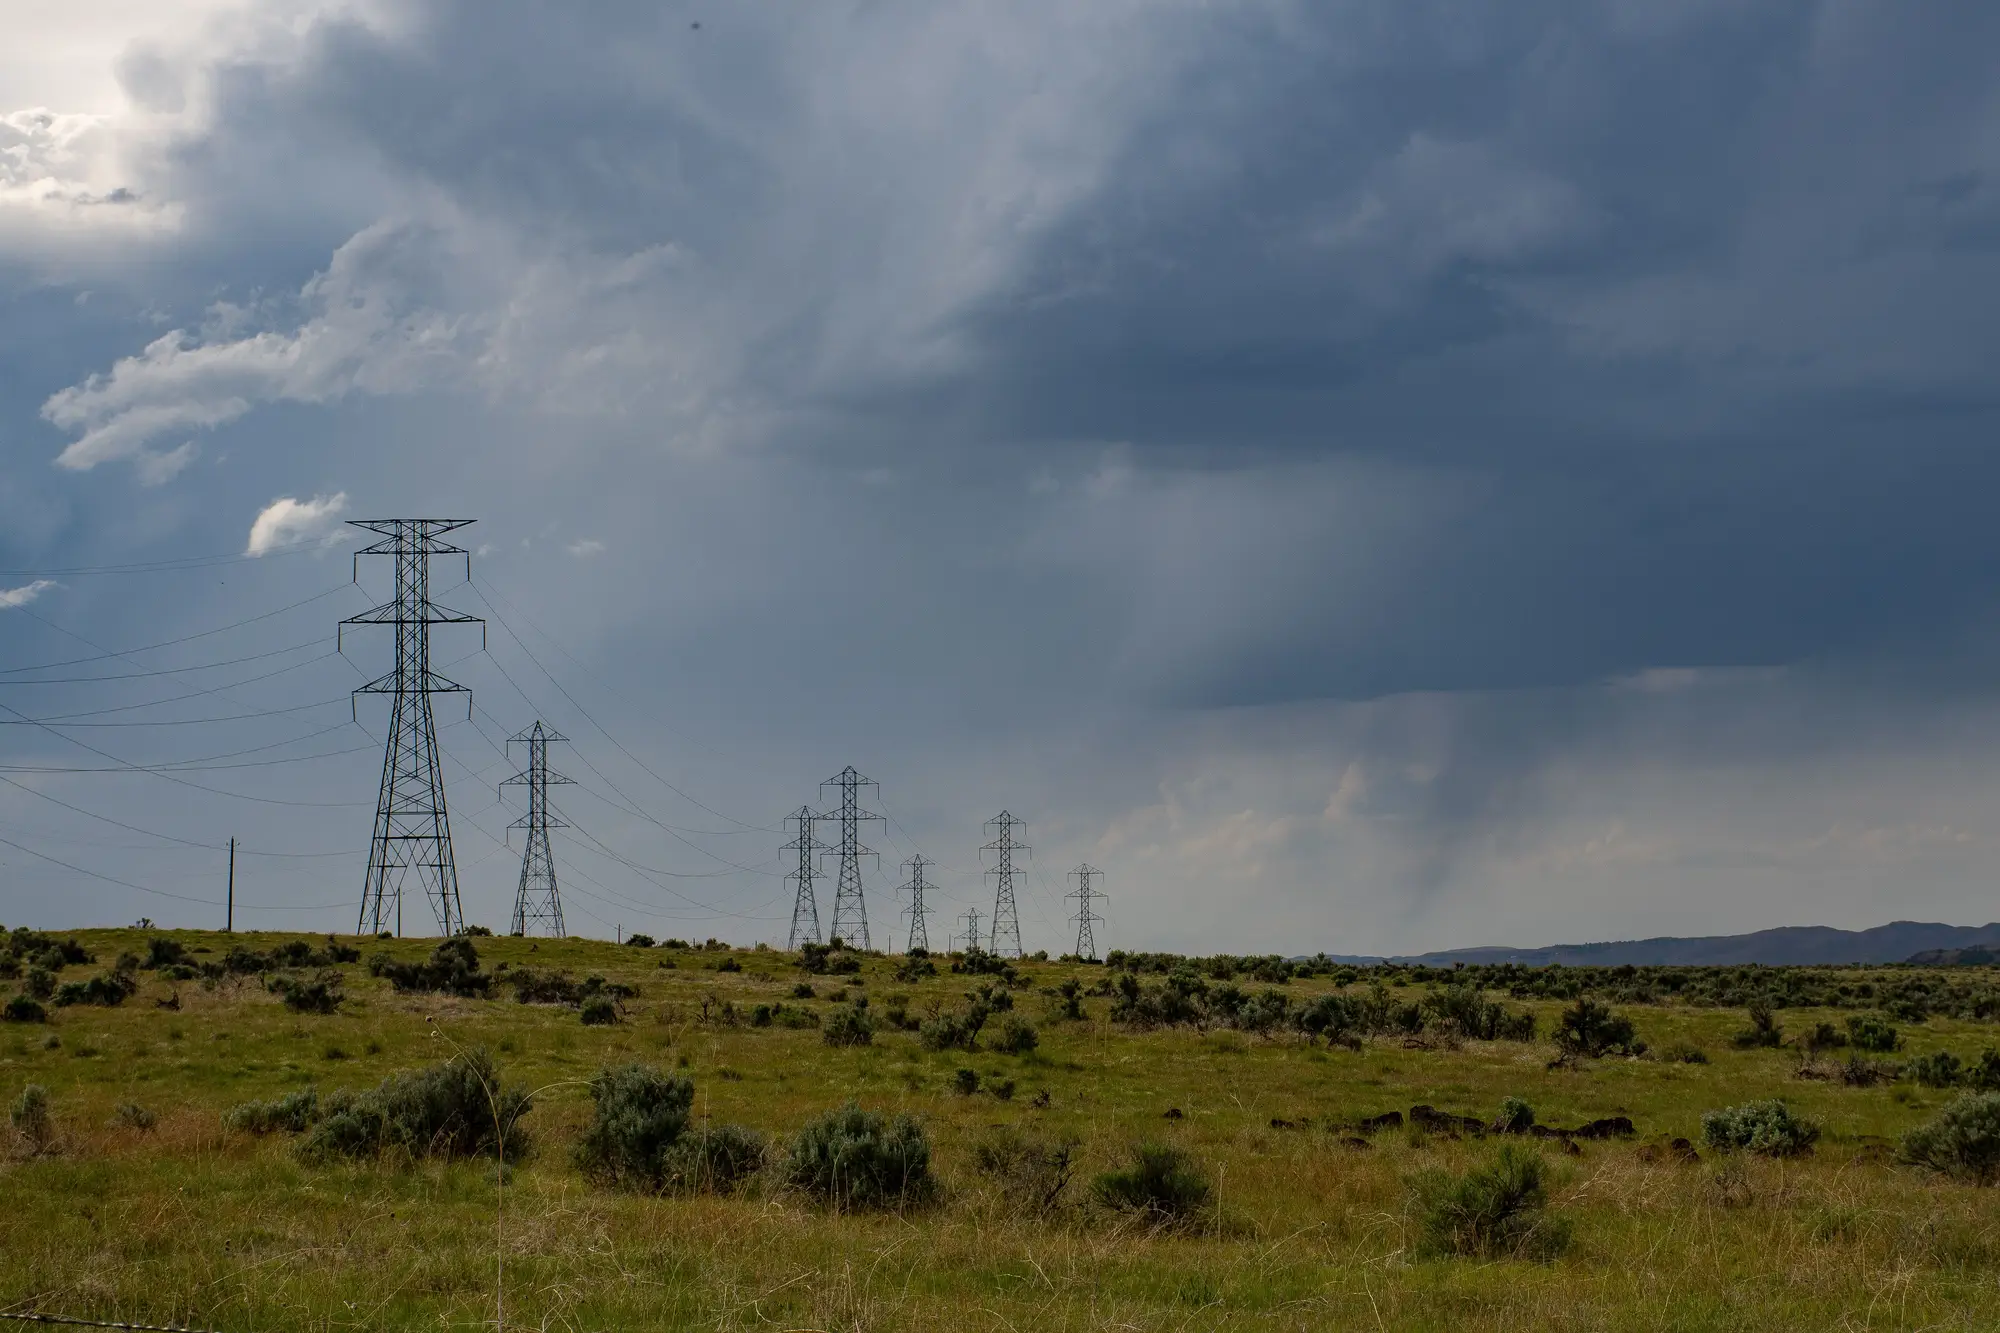
Substations, transmission lines and cleared corridors are identified in the imagery. What the imagery cannot show is left off, not guessed.
- Out
Route and deliver
A routed distance and path per site, the region map and the table. We go through the first few sites with you on a call.
- 1 Candidate site
- 2 Substation
- 3Straight line, the ruler number. It crosses the river and the ridge.
- 4Routed path, out to the existing corridor and along it.
Schematic only. Not drawn from any real site.
Limits
- Condition
- Resolution
- Effect on the output
- At 0.5–2 m a substation yard is many pixels across and easy to find. A tower footprint is a few metres, so at the coarse end it is a pixel or two. Lines are followed by their cleared corridor and the towers that resolve. Distribution feeders and wood poles are not traced.
- Condition
- Visible infrastructure only
- Effect on the output
- Underground cable, and any line or substation built since the pass, will not appear. A site can look farther from the grid here than it is.
- Condition
- The route is plausible, not final
- Effect on the output
- The path is drawn from visible infrastructure and terrain. It is not a survey, a design or an easement. Verify with the utility and a surveyor before committing capital.
- Condition
- Physical location, not capacity
- Effect on the output
- This maps where infrastructure is. It says nothing about available capacity, queue position, upgrade cost or whether the utility would accept a connection.
- Condition
- Cloud and canopy
- Effect on the output
- Optical imagery needs a clear-sky window. Cloud or snow can push the pass later, and corridors under dense tree cover are flagged low-confidence.
- Condition
- Annual cadence
- Effect on the output
- One pass per region per year, more often on request. It is a screening layer, not continuous monitoring of the grid.
Why the ruler number is not enough
Early screening runs on a desktop map. You drop a pin on the parcel, pull a substation and line layer from a public dataset or a utility extract, and measure to the nearest substation. That figure goes in the site file and the shortlist gets sorted on it.
The ruler ignores the river, the highway, the ridge and the easements between the pin and the substation, and the extract may predate whatever was built last year. The site that ranked well turns into a long, awkward gen-tie once someone traces the actual route.
Who it's for
For
- Grid connections analysts and interconnection managers at renewables developers, screening candidate sites.
- Investors and acquisition teams who need a comparable distance figure across a portfolio of sites.
- A GIS analyst on the same team who will check the layers against the utility's data.
Not for
- Teams after available capacity or a queue position. Only the utility can say, and it does so in its studies.
- Cost-to-connect estimates or construction-ready routing.
- Mapping underground or newly built lines.
- Distribution-level connection of small rooftop systems.
Questions before a pilot
Does this confirm available grid capacity?
No. It shows physical infrastructure only. Capacity, queue position and upgrade cost come from the utility and its studies.
How good is the routed distance?
It is a plausible path along visible infrastructure and terrain, there to rank sites. Check it with the utility before you commit money to a site.
How do we check it against our own data?
Choose pilot sites where you already hold a surveyed route or a utility-confirmed distance and keep that figure back. Compare it with the delivery site by site and decide whether the layer is good enough for screening.
What formats does it arrive in?
GIS layers your desktop GIS opens, and a CSV for the site file. We do not write into your pipeline tracker.
How current is it?
One pass per region per year, with more on request. Anything built after the pass will not show until the next one.
Does it include underground lines?
No. Only what shows in optical imagery.
Can we load it next to our own layers?
Yes. Layers are keyed to your site IDs, so they sit beside your parcel and constraint layers.
Who owns the results and the imagery?
Ownership and licence terms for the deliverables and the imagery go in the pilot agreement before anything is ordered. Ask for them early if your legal team needs to review.
How is a pilot bought and priced?
Scope depends on the number of sites and the region, and we price the pilot area you choose. Tell us how you buy data and we will fit the scope to it.
Put a real distance on your shortlist.
Send us the candidate sites you would put in a pilot and the date your shortlist has to be firm. We will tell you whether the imagery calendar can meet it.
Start a pilot