Blog
Nov 16, 2026
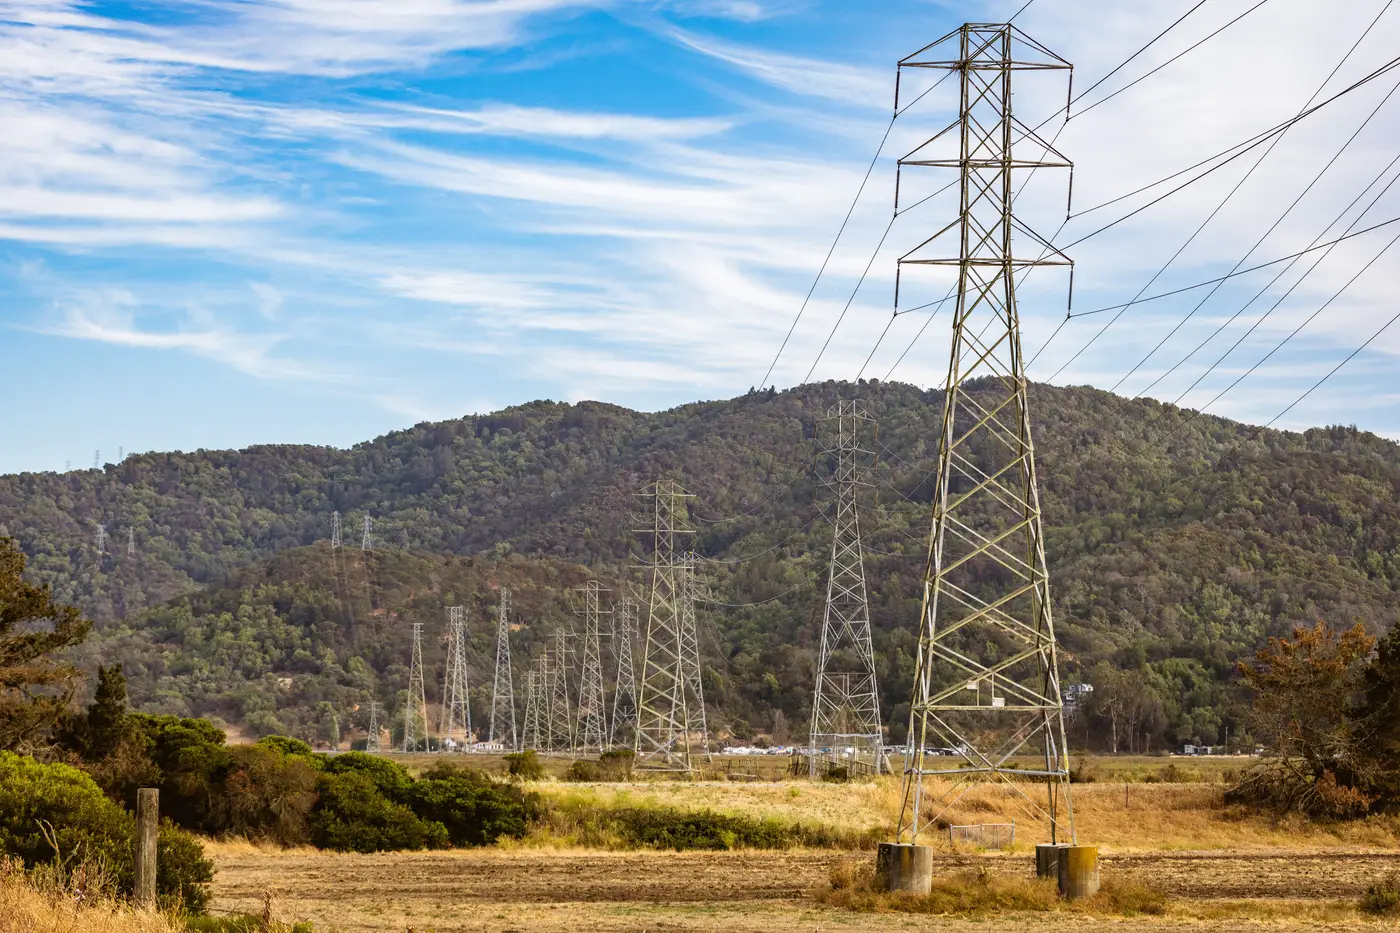 The ridge that turned a two-mile gen-tie into six
A field note on why straight-line gen-tie distances fall apart on ridge terrain, and what a real corridor route costs instead.
Nov 16, 2026
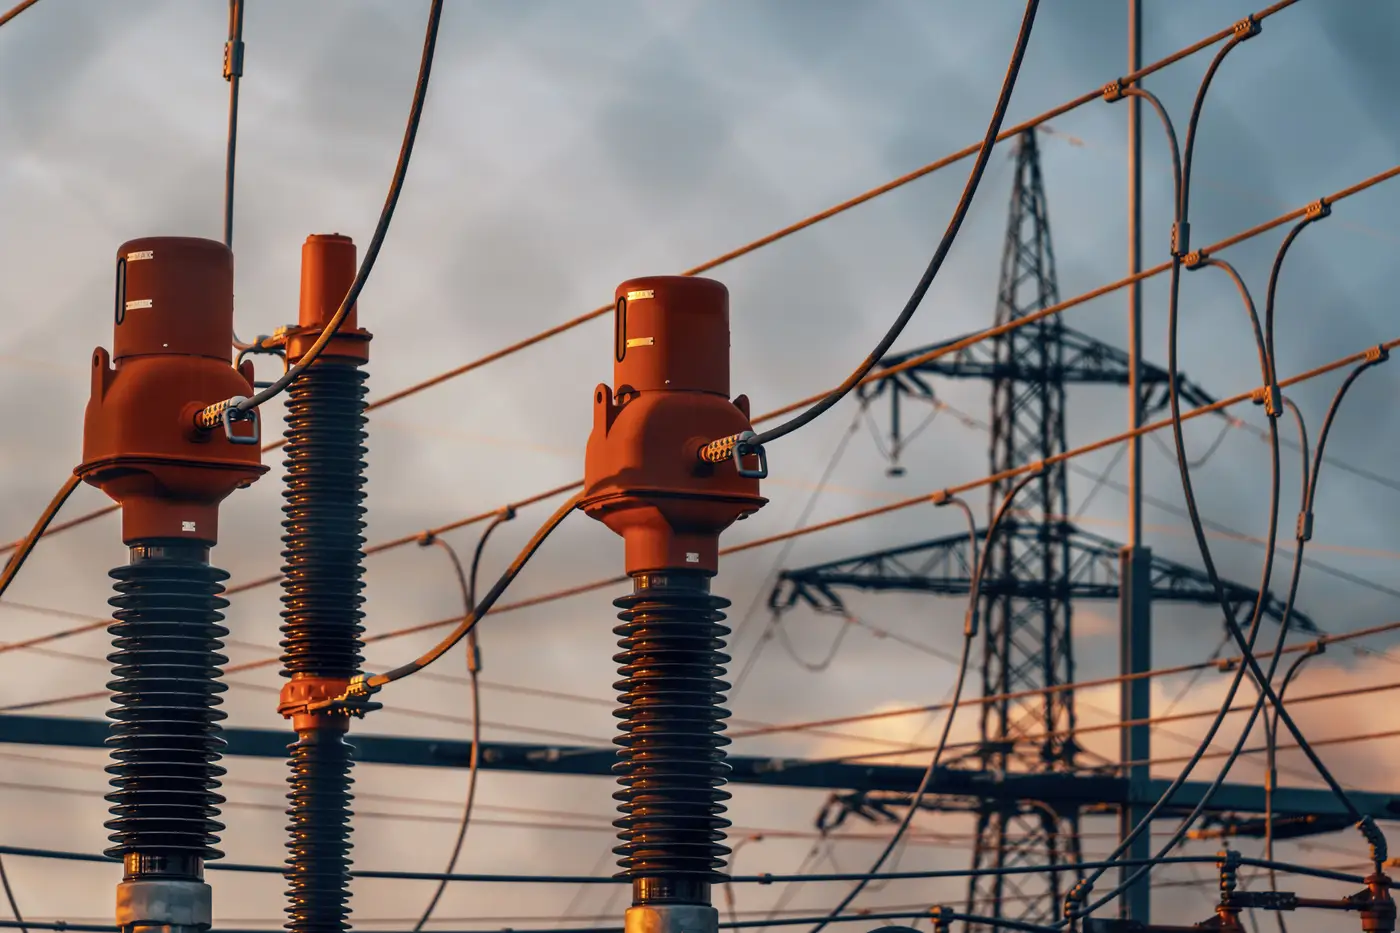 Network upgrade cost explained: why it can dwarf your gen-tie distance estimate
Network upgrade cost explained: why interconnection cost allocation often has little to do with gen-tie distance, and what actually drives the number.
Nov 9, 2026
Crow-flies vs. routed distance: why your gen-tie estimate needs a real routeStraight-line distance to the nearest substation undersells gen-tie cost. Here's why routed distance changes the interconnection math.
Nov 9, 2026
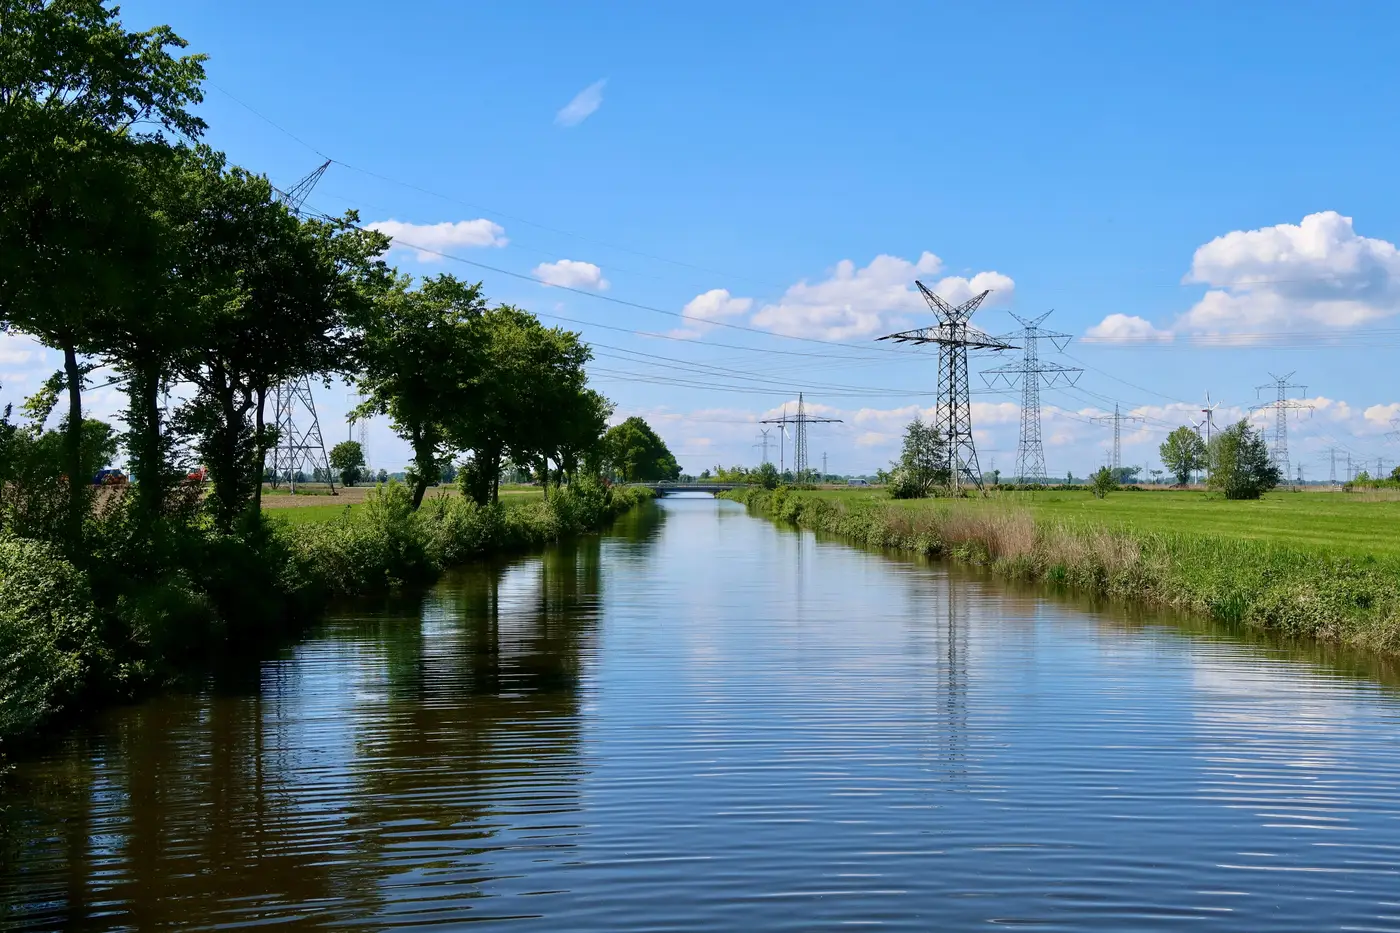 How to spot river and highway crossings before pricing a gen-tie route
A desktop method for flagging watercourse and highway crossings early, before a gen-tie cost estimate gets built on a straight line that was never buildable.
Nov 2, 2026
 Field notes: the site that measured half a mile on the map and four on the ground
A ruler measurement said half a mile to the substation. The route that worked ran four. On why straight-line distance keeps fooling screening teams.
Nov 2, 2026
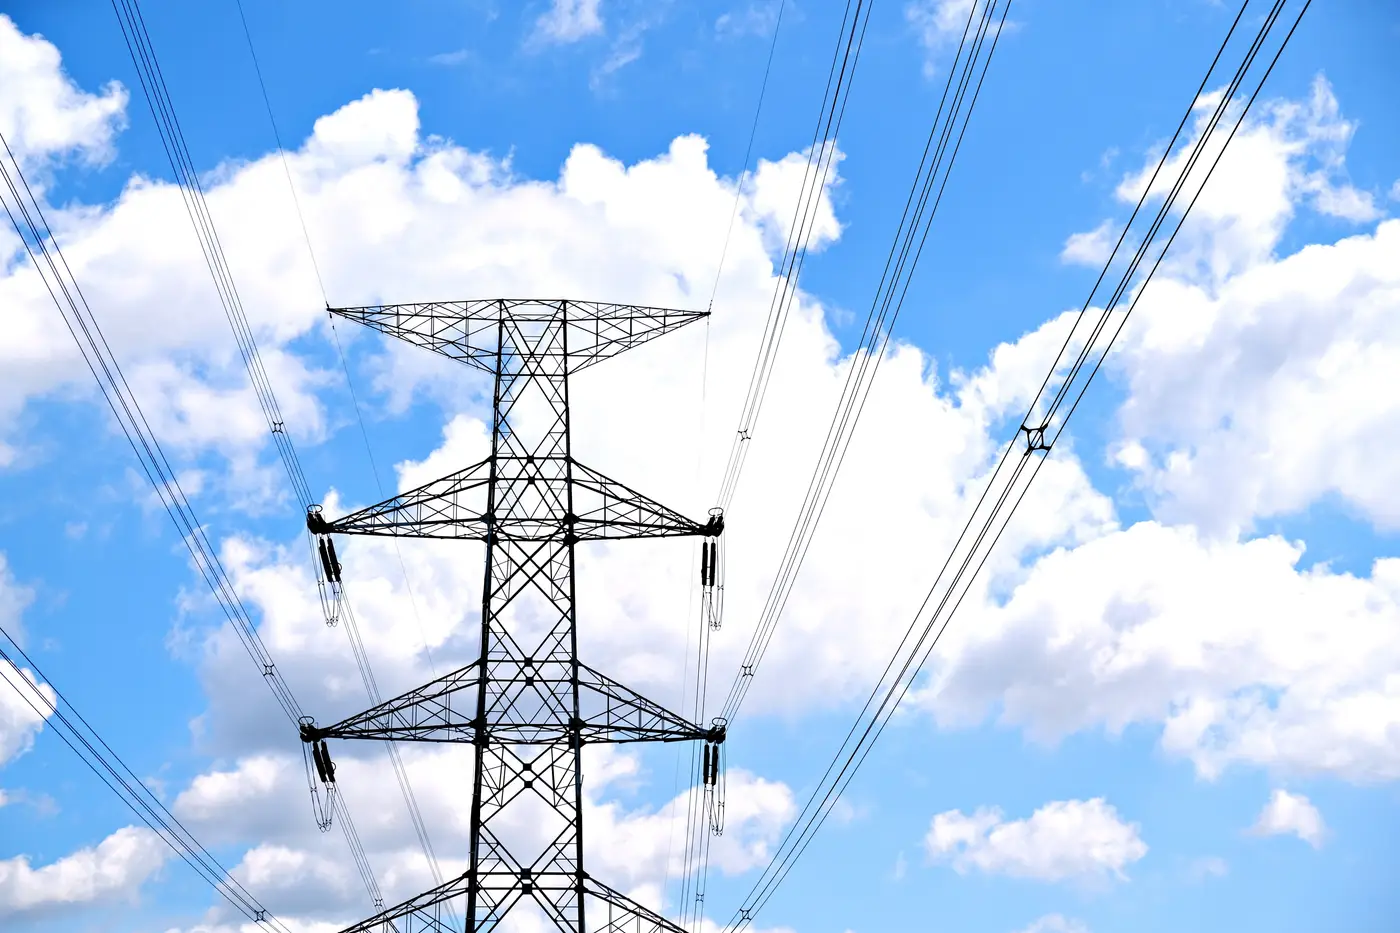 Optical satellite imagery vs utility GIS extracts for siting substation distance
Utility GIS extracts lag the field. Here's how optical satellite imagery holds up for substation location verification and distance work.
Oct 26, 2026
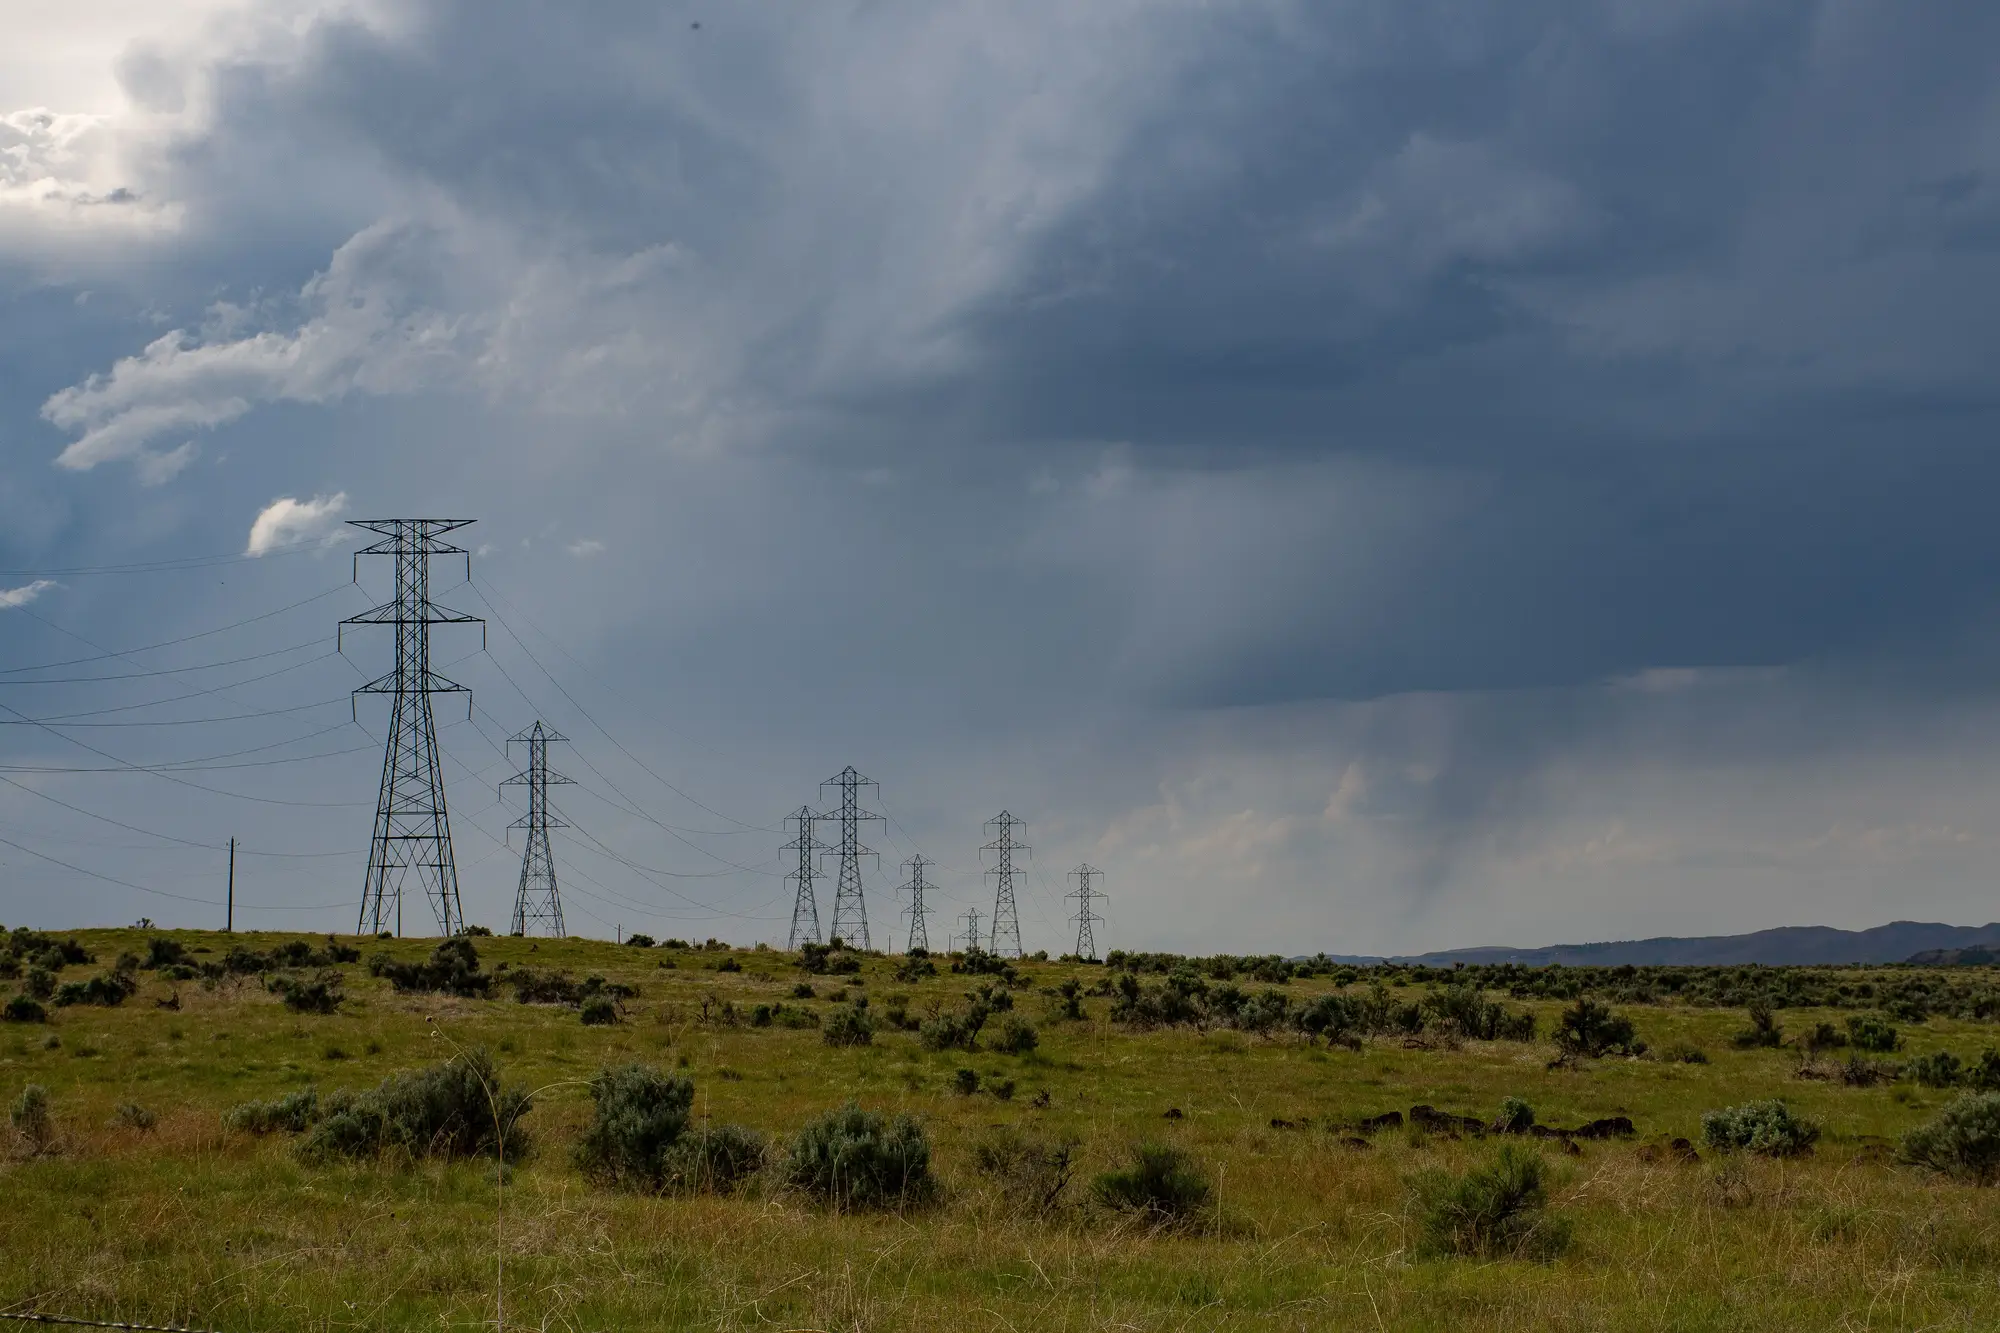 How to flag a right-of-way crossing before you route a gen-tie line
A guide to spotting easement and right-of-way conflicts along a gen-tie corridor before you route the line, not after title search.
Oct 26, 2026
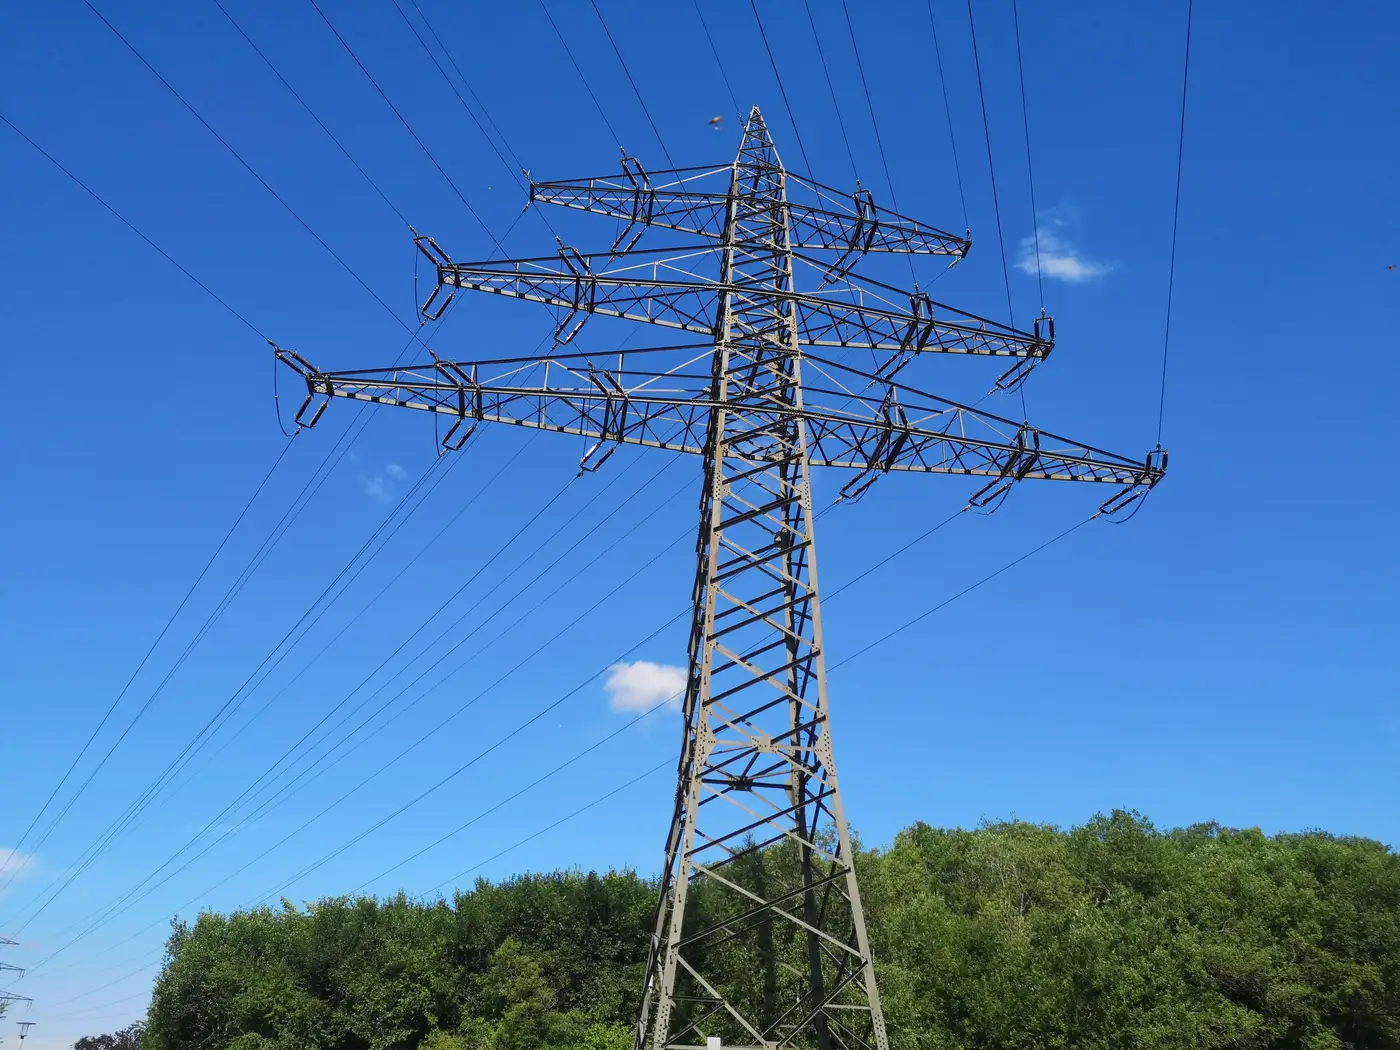 What GSD resolves a transmission tower in satellite imagery?
A practical look at ground sample distance for identifying lattice towers and monopoles from overhead imagery, and where that resolution runs out.
Oct 19, 2026
Field notes: the parcel that looked grid-adjacent until we traced the corridorA screening story about a site that measured 1.1 miles to the substation on a desktop map and ran 4.6 miles once the actual corridor got traced.
Oct 19, 2026
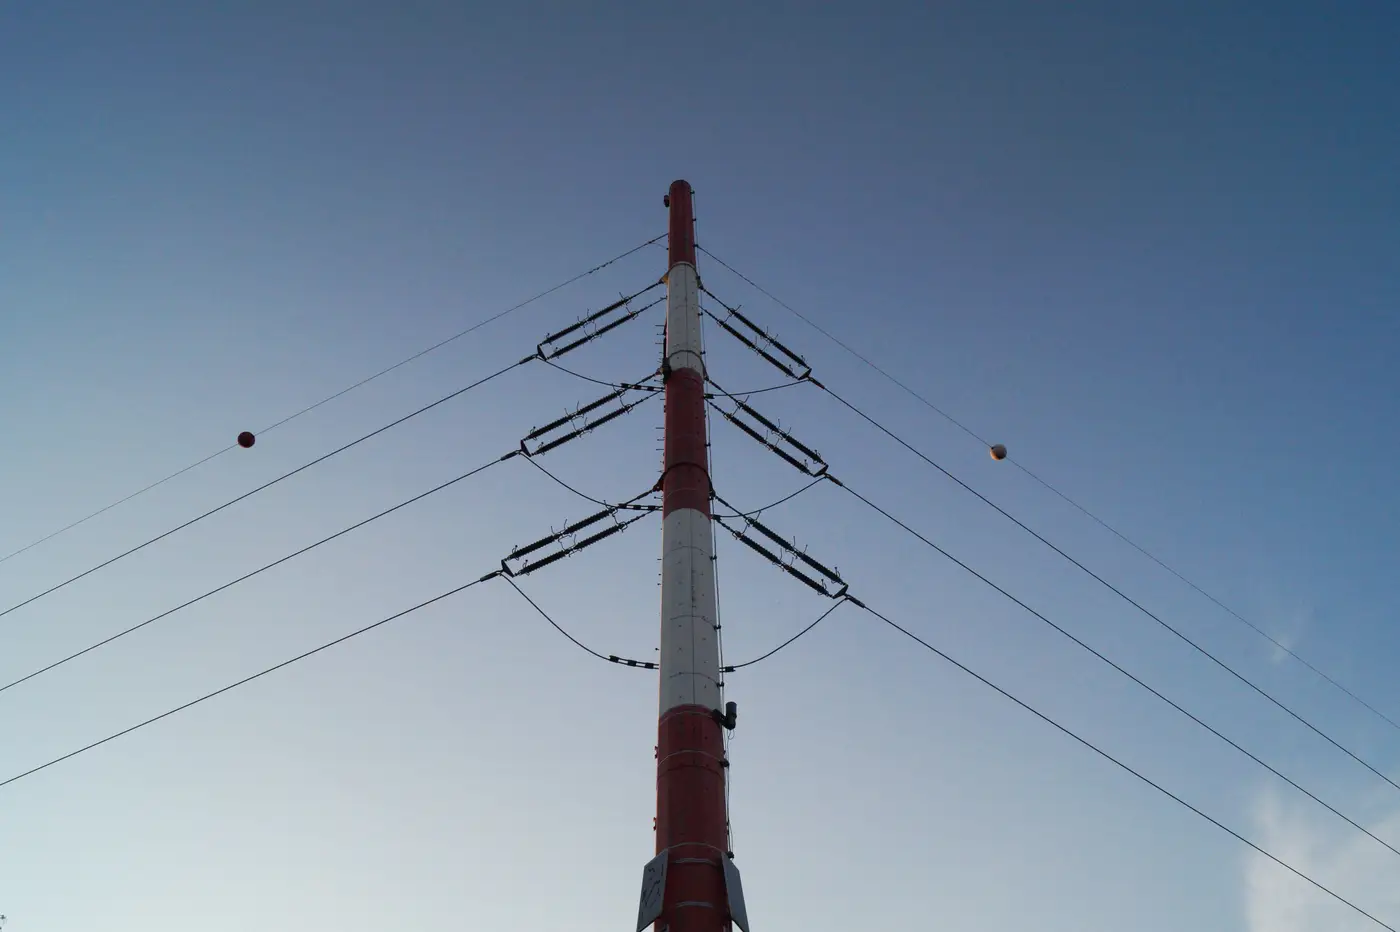 Overhead or buried? Reading a transmission corridor in satellite imagery
Visual cues for telling an overhead transmission corridor from a buried cable route in high-res satellite imagery, for desktop grid connection screening.
Oct 14, 2026
Single-circuit vs double-circuit towers in satellite imageryHow to tell single-circuit from double-circuit transmission towers in satellite imagery by crossarm tiers, conductor bundle count and insulator strings.
Oct 14, 2026
What a wheeling rate is and why it can flip your gen-tie mathA plain explanation of wheeling rates and how the actual gen-tie route, not the straight-line distance, decides which rate schedule you're stuck with.
Oct 13, 2026
How to estimate transmission line voltage class from tower height and conductor countField notes on reading tower height, bundle count, and insulator strings to judge a transmission line's voltage class before you confirm with the utility.
Oct 13, 2026
Lattice tower vs monopole: telling them apart in satellite imageryHow to distinguish lattice towers from monopoles in satellite imagery, and why the structure type changes your corridor routing call.
Oct 7, 2026
Distribution vs. transmission interconnection: what changes at the POIDistribution vs. transmission interconnection, explained by voltage class, queue process, and what the point of interconnection really decides.
Oct 7, 2026
How to read a utility GIS extract for substation capacityA field guide to utility GIS extracts: what the substation capacity attributes tell you, and where the hosting capacity map stops being useful.
Oct 7, 2026
What counts as available hosting capacity at a substation?Firm capacity vs available capacity, why bay availability matters, and how to read a hosting capacity map without getting burned at NTP.
Oct 7, 2026
What is a system impact study in the interconnection queue process?A plain-language look at what a system impact study covers, where it sits in queue stages, and how it differs from a cluster study.