November 2, 2026
Field notes: the site that measured half a mile on the map and four on the ground
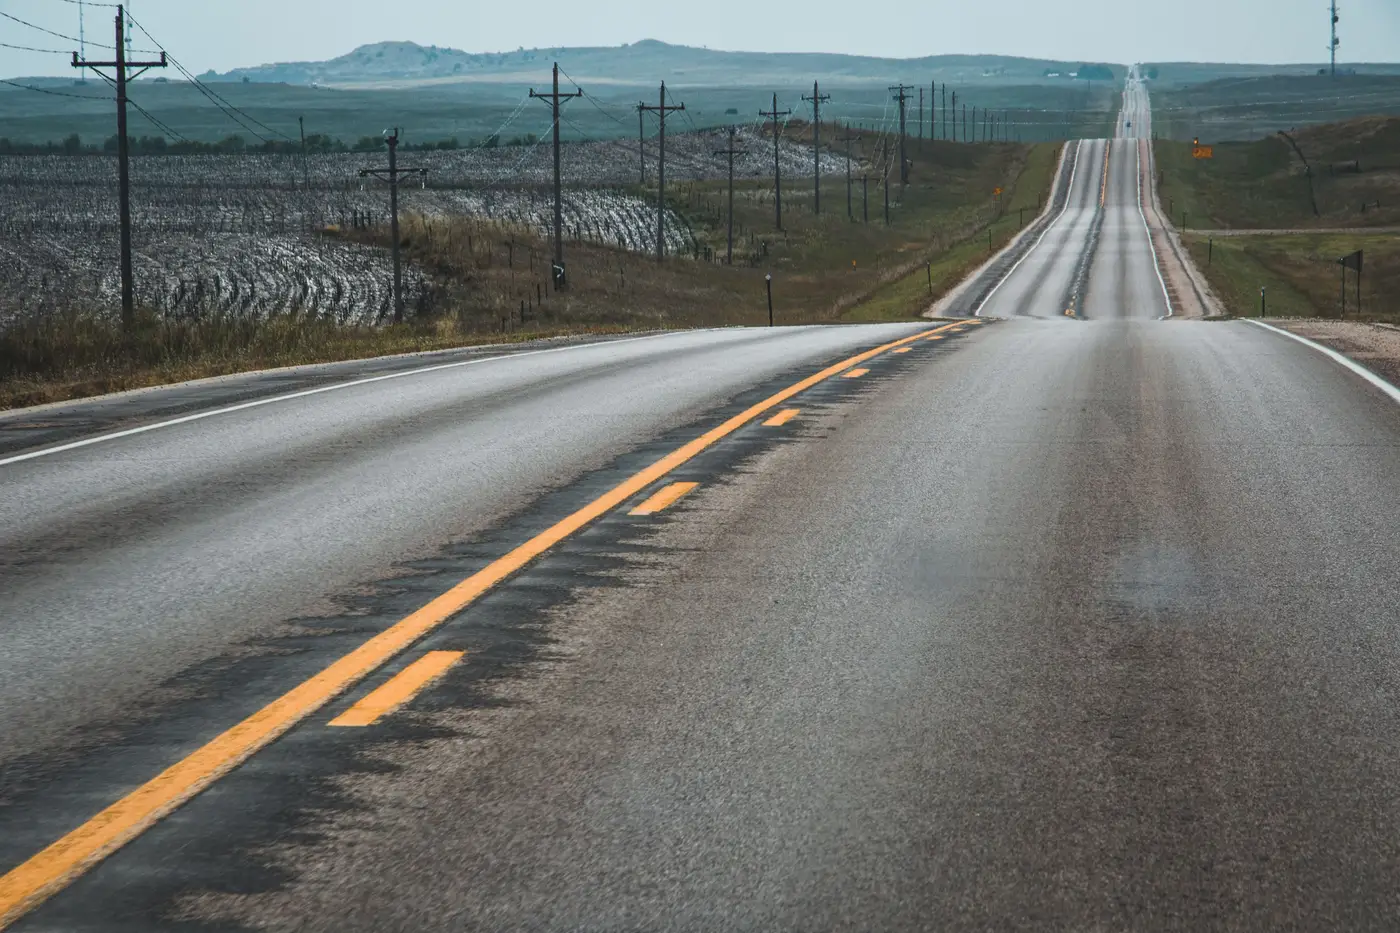
The parcel looked clean on paper. Flat, 240 acres, zoned ag, a 115 kV substation sitting 0.6 miles away in a straight line on the screening map. Someone on the development team had measured it with the ruler tool in their desktop GIS, written "0.5 mi to POI" in the screening memo, and moved the site to the next stage. Nobody questioned it, because nobody had a reason to yet.
It took a landowner call to surface the problem. The parcel the ruler crossed to reach that substation belonged to a different family than the one negotiating the lease, and that family had no interest in an easement. So the team went looking for another way in, and that's when the half mile started to unravel.
Between the candidate site and the substation sat a river with no nearby crossing, a state highway with a narrow ROW the DOT treats as off-limits for utility co-location, and a Class I rail corridor that had gone in two years after the utility's last GIS extract was pulled. None of that shows up on a straight line. It shows up only once you trace where a line could actually go.
The route that finally worked ran north along a county road easement, crossed the rail at an existing grade crossing instead of cutting a new one, skirted the wetland boundary by about 400 feet, and came back south to the substation along a second county road. Four miles. Not four miles because the land is hilly or the terrain is difficult. Four miles because every direct path had something in the way that a ruler doesn't know about and a three-year-old utility extract hadn't caught up to yet.
This is the part that gets lost in early screening. The interconnection queue cares about distance to the POI, sure, but construction cost cares about distance along a buildable corridor, and those are rarely the same number. A 0.5-mile estimate and a 4-mile reality don't just change a cost line item. They change whether the site clears the screen at all once you run the real per-mile build cost against the project economics.
The utility GIS extract is only as current as the day someone last pulled it, and infrastructure doesn't sit still waiting for a refresh cycle. Rail spurs get built. Substations get fenced and re-fenced. A transmission corridor that looked open on last year's parcel data has a new solar project's own gen-tie running through it now. Working off an extract that was accurate when someone requested it means working off whatever the grid looked like at that moment, not what it looks like when your interconnection application gets filed.
The fix for this one site took a field visit, a call to the county road department, and about a week of back-and-forth before anyone trusted the four-mile number enough to put it in a revised memo. That's a week spent on one parcel. Most portfolios have forty of them in screening at any given time, and the ones that get the straight-line treatment are the ones that come back to bite someone during due diligence, usually right when a buyer's engineering team starts asking why the interconnection cost estimate doubled.
What this site needed at the screening stage was a current picture of where the substation, lines, and corridors sit, so the route distance shows up before the landowner call does, not after. That's the gap Grid Proximity Mapping is built to close, mapping substations, lines, and their corridors against current imagery so the screening number and the construction number stop being strangers.
If your pipeline has a parcel carrying a ruler-distance that nobody's double-checked against a real corridor, it might be worth putting it in front of Grid Proximity Mapping before your next investment committee meeting does.