October 13, 2026
How to estimate transmission line voltage class from tower height and conductor count
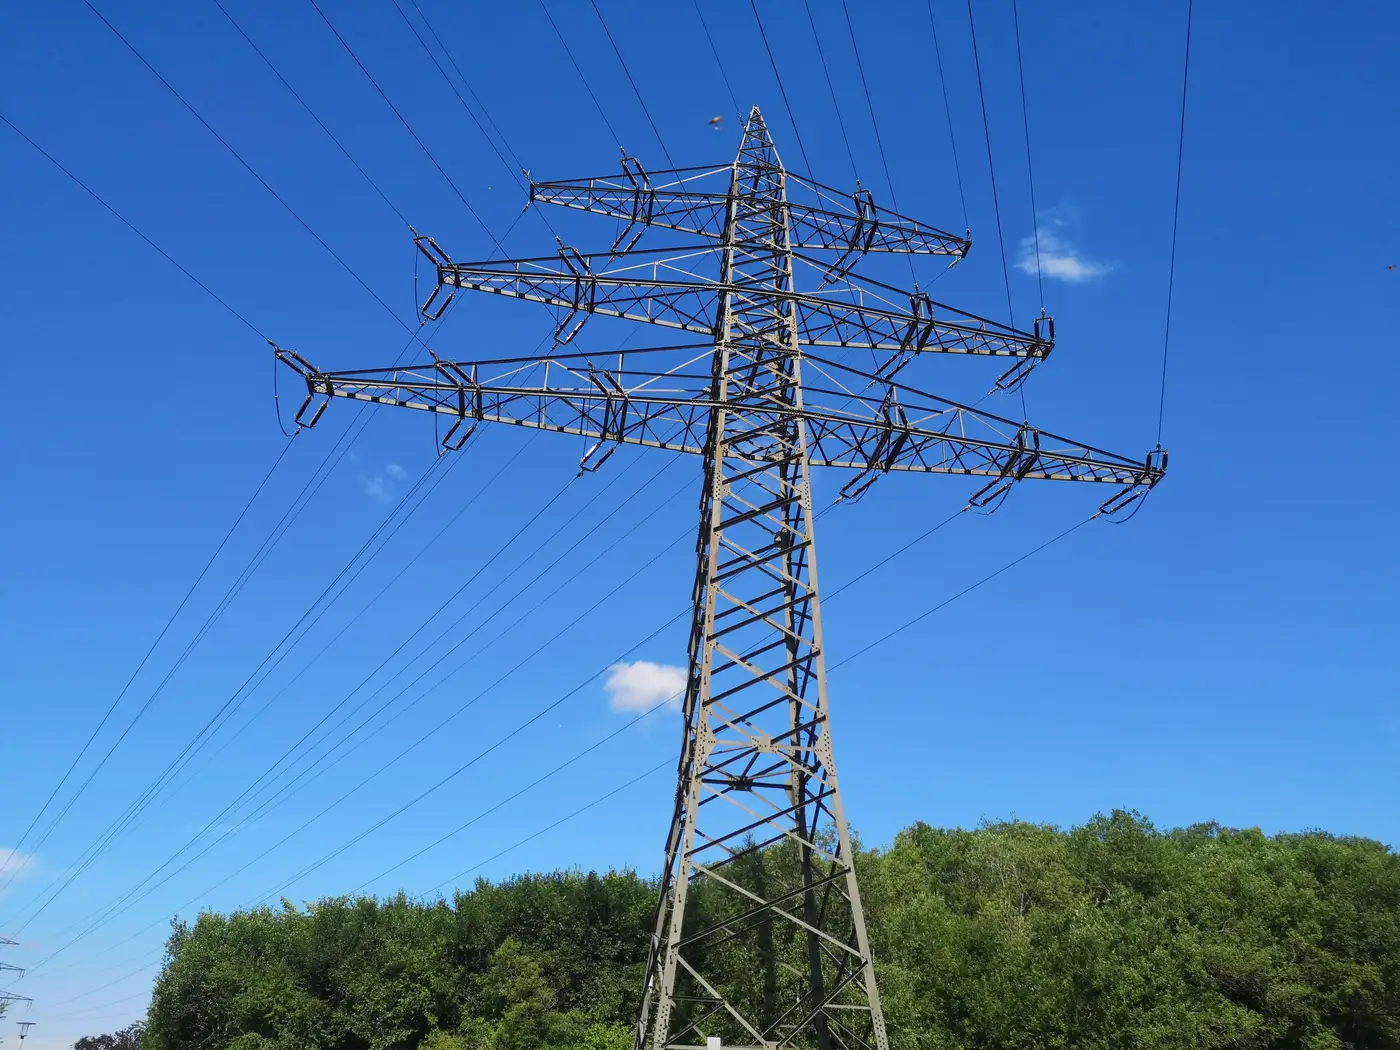
You're standing at a candidate site, or more likely you're scrolling satellite imagery at 2x zoom trying to figure out if that line running along the ridge is a 69 kV tap or something with real headroom for an interconnection. The utility GIS layer is six months stale, the ISO queue map doesn't label voltage, and you need a working number before the call with the transmission owner. This is the desk-review trick every connections analyst eventually learns: structure geometry tells you most of what you need before anyone confirms it on paper.
What tower height tells you
Height alone is the roughest proxy, but it's the first filter. Wood H-frame or single-pole structures in the 40 to 60 foot range are almost always 69 kV or below, built for local distribution tie-ins and rural laterals. Once you're looking at steel poles or light lattice in the 60 to 90 foot band, you're in 115 to 138 kV territory, the workhorse subtransmission voltage in most of the Midwest and Southeast.
Lattice towers climbing past 100 feet usually mean 230 kV, and this is where things start to matter for a renewables project, since 230 kV is often the practical floor for a utility-scale interconnection without a long gen-tie. Push past 130 feet with wider cross-arm spacing and you're likely looking at 345 kV. The true giants, 500 kV and 765 kV lines, run 150 to 200+ feet with cross-arms you can spot from a mile off just by the shadow they throw at midday.
Height varies with terrain and span length too. A 345 kV line crossing a wide river valley will use taller structures than the same voltage line on flat, open ground. Use height as a first filter, then confirm with conductor bundle count before you commit to a voltage class in your screening notes.
Conductor bundle count and voltage
This is the tell that separates voltage classes reliably, and it's the one most desk reviewers skip because it takes a closer look at the imagery or a decent zoom lens from the ground.
Count the conductors hanging from each phase position, not the total wires on the tower.
- A single conductor per phase, no visible spacing hardware, points to 69 through 161 kV.
- Twin bundles, two conductors held apart by a spacer about 18 inches, show up at 230 kV and sometimes 345 kV.
- Triple bundles mean you're almost certainly at 345 kV.
- Quad bundles, four conductors in a square arrangement with a spacer frame, are the signature of 500 kV.
- Hex or octagonal bundles are reserved for 765 kV, the rare stuff most analysts will see once or twice in a career.
Utilities bundle conductors at higher voltages to manage corona loss and surface field gradient. That's a separate engineering reason from current capacity, and it correlates well enough with voltage class to use as a field read.
Insulator strings back this up. Count the discs hanging between the cross-arm and the conductor. Five to seven discs is 69 to 115 kV. Nine to eleven is 138 to 230 kV. Fourteen or more, especially with a long V-string rather than a single vertical drop, usually means 345 kV and up. Longer strings mean more insulation distance, which means higher voltage stress to manage.
Where the visual read stops being enough
None of this tells you what's available for interconnection. A 230 kV line can be fully subscribed on its thermal rating, or it can be a radial tap with no looped capacity at all. Structure geometry gets you a defensible first cut at voltage class for screening a dozen candidate sites down to three worth a formal interconnection study. It doesn't substitute for the utility's actual line rating or the queue position of everyone ahead of you.
What it does solve is the other half of the screening problem: once you've guessed the voltage right, you still need an honest distance to that line and a route that actually follows a road or existing corridor instead of a ruler line across a wetland. That's the gap our substation and corridor layer at Grid Proximity Mapping is built to close, pairing the voltage read with a real connection distance instead of a straight-line guess on a desktop map.
If you're tired of re-estimating tower geometry for every site in your pipeline, it might be worth seeing what a mapped distance-and-route layer looks like for your next batch of candidates.