October 19, 2026
Overhead or buried? Reading a transmission corridor in satellite imagery
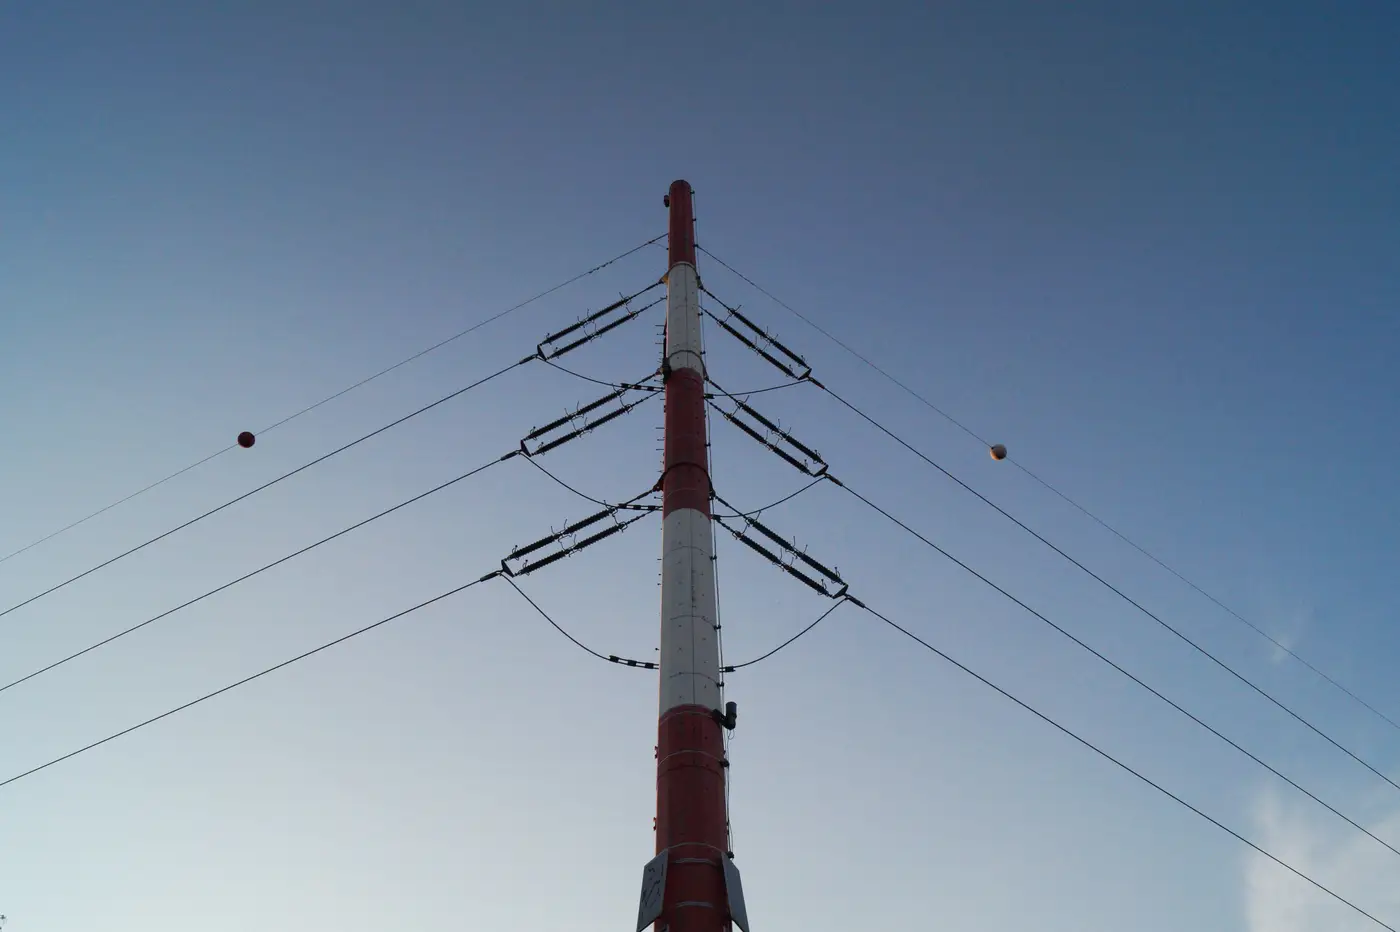
A desktop screen rarely tells you the voltage or ownership of the line running near a candidate site. What it can tell you, if you know what to look for, is whether that line is strung on towers or sitting in a trench, and that distinction changes your connection cost estimate before you've made a single call to the DNO or TSO.
Overhead and buried routes leave different marks on the ground. Here's what separates them when you're working from imagery instead of a utility GIS extract.
What an overhead corridor looks like from above
The giveaway isn't the conductors. At 0.5-2 m resolution you won't resolve a wire, but you will resolve what the wire forces the landowner to do underneath it.
Look for a cleared swath cutting through forest or scrub, straight between kinks, with a different color and texture than the land either side. That's the managed right-of-way. The edges aren't razor-straight; where the line crosses between two towers the clearance follows the conductor's sag, so the cut has a slight scallop or catenary curve along each span rather than a hard rule-straight edge.
Then look for the towers themselves. Lattice structures cast a distinctive cross-shaped or X-shaped shadow at regular intervals, and the interval is fairly consistent for a given voltage class, so a repeating structure every few hundred meters along the corridor is a strong tell even before you can make out the tower shape. Direction changes in the route happen at a tower, not mid-span, so if the corridor kinks sharply, there's almost always a structure sitting right at that kink.
Overhead routes also don't care much about terrain. They'll go straight across a valley or a river because the span just gets longer, where a buried route has to do something else entirely at that same obstacle.
What a buried cable route looks like from above
Underground circuits are quieter on imagery, which is exactly the problem for a candidate-site screen. There's no tower shadow and usually no wide cleared band, because the cable sits below grade and the surface above it can carry ordinary land use again once reinstatement is done.
What you're often looking at instead is a narrow disturbance strip, sometimes visible for a season or two after construction as a slightly different vegetation color or soil tone along the trench line, before it fades back to match the surrounding field. That strip tends to hug existing linear features: road verges, field boundaries, hedge lines, rail corridors, because trenching along an existing easement is cheaper than cutting a fresh one, so the route is noticeably more sinuous than an overhead line's beeline-between-towers path.
Joint bays and splice vaults show up as small, regular rectangular or circular features spaced along the route, and at a water crossing done by directional drilling you'll sometimes spot a cleared entry or exit pad close to the bank rather than the cable just marching straight across the way an overhead span would.
You're reading surface evidence and inferring what sits underneath it. That's exactly why a straight-line ruler measurement on a desktop map makes such a weak starting point for a connection distance: the eye draws the route across open ground, while the real route follows terrain, ownership and existing corridors.
That's the gap a GIS extract or a quick satellite look leaves open on every candidate site. Grid Proximity Mapping maps substations and transmission corridors from high-res imagery so each site comes with a real connection distance and a plausible route rather than a guess drawn on a desktop screen.
If your screening list has sites where the nearest line's status is still a question mark, that's worth running through a corridor read before it goes into a connection cost estimate.