October 26, 2026
What GSD resolves a transmission tower in satellite imagery?
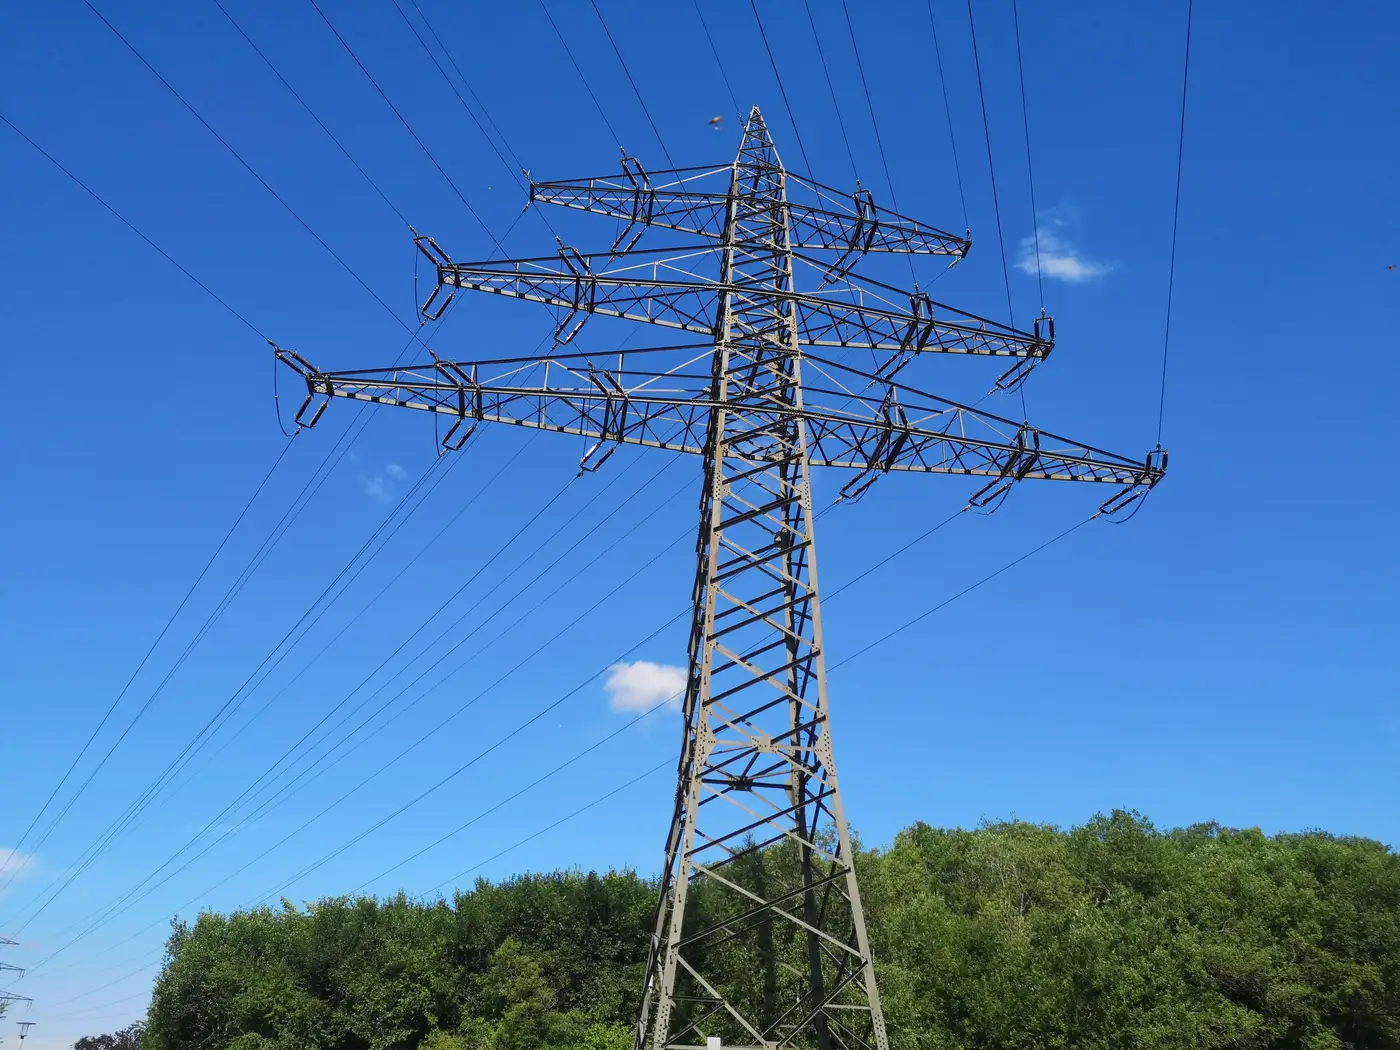
Ground sample distance gets thrown around loosely in grid connection conversations. Someone says "we used 3 m imagery" and someone else nods like that settles it. It doesn't, because the answer to "can you see the tower" depends on what you mean by see.
Pixels on target, not just GSD on paper
A single pixel covering 2 m of ground doesn't give you a tower. It gives you a bright or dark speck depending on sun angle and background. Resolving a structure as a tower rather than guessing at a shadow or a silo takes enough pixels across its footprint and cross-arm span that the shape reads as a tower to a human analyst or an automated classifier. A handful of anomalous pixels on their own won't do that.
Lattice transmission towers typically run a few meters across at the base and spread wider at the cross-arms, often 10-20 m depending on voltage class. At 0.5 m GSD, a cross-arm that wide gives you 20-40 pixels along its length, enough to pick out the characteristic X-brace shape against a field or forest background. At 1-2 m GSD you lose the brace detail but can still flag a regularly spaced structure sitting on a known line alignment, which is often enough if you're confirming a corridor rather than counting bolts.
Monopole and tubular steel structures are harder at coarse resolution because they're thinner and don't have the cross-arm spread that lattice towers give you. A monopole that reads clearly in 0.5 m imagery can disappear into a single ambiguous pixel at 2 m, especially with a shadow falling across it or snow on the ground washing out contrast.
Where this matters for a connection study
Most grid connections analysts aren't trying to resolve individual bolts on a tower. The real question on a candidate site is where the nearest line and substation sit, what route a spur would plausibly take, and whether that route crosses terrain or rights-of-way that change the connection cost. For that work, resolving the tower well enough to confirm it exists and sits where the utility GIS extract says it does matters more than counting cross-arms.
This is also where the gap between a desktop ruler measurement and a real route shows up. A straight-line distance from a candidate site to the nearest substation pin on a map ignores terrain: the line might run through a valley, around a wetland, or along an existing corridor that adds a kilometer or two to any realistic spur. Fine GSD imagery lets you trace the corridor itself, and that trace is what turns a guess into a route.
A rough working guide
As a rule of thumb for lattice towers: 0.5-1 m GSD will generally let you resolve individual structures and confirm alignment. 1-2 m GSD will usually confirm that a line exists and roughly where it runs, but individual tower shape gets ambiguous. Beyond 2-3 m you're mostly reading the corridor clearing itself, the vegetation cut or access track, rather than the towers.
None of this replaces a field survey or an as-built from the transmission owner when precision actually matters for interconnection studies. What satellite resolution buys you is a fast, repeatable way to check whether a candidate site's "nearest substation" figure on a spreadsheet matches what's on the ground, and whether the route between them is plausible or optimistic.
Grid Proximity Mapping builds that check into an annual distance-and-route layer from high-res satellite imagery, so a candidate site carries a real connection distance instead of a straight line drawn on a desktop map.
If you're screening sites and want the corridor checked before it goes into a model, get in touch.