October 14, 2026
Single-circuit vs double-circuit towers in satellite imagery
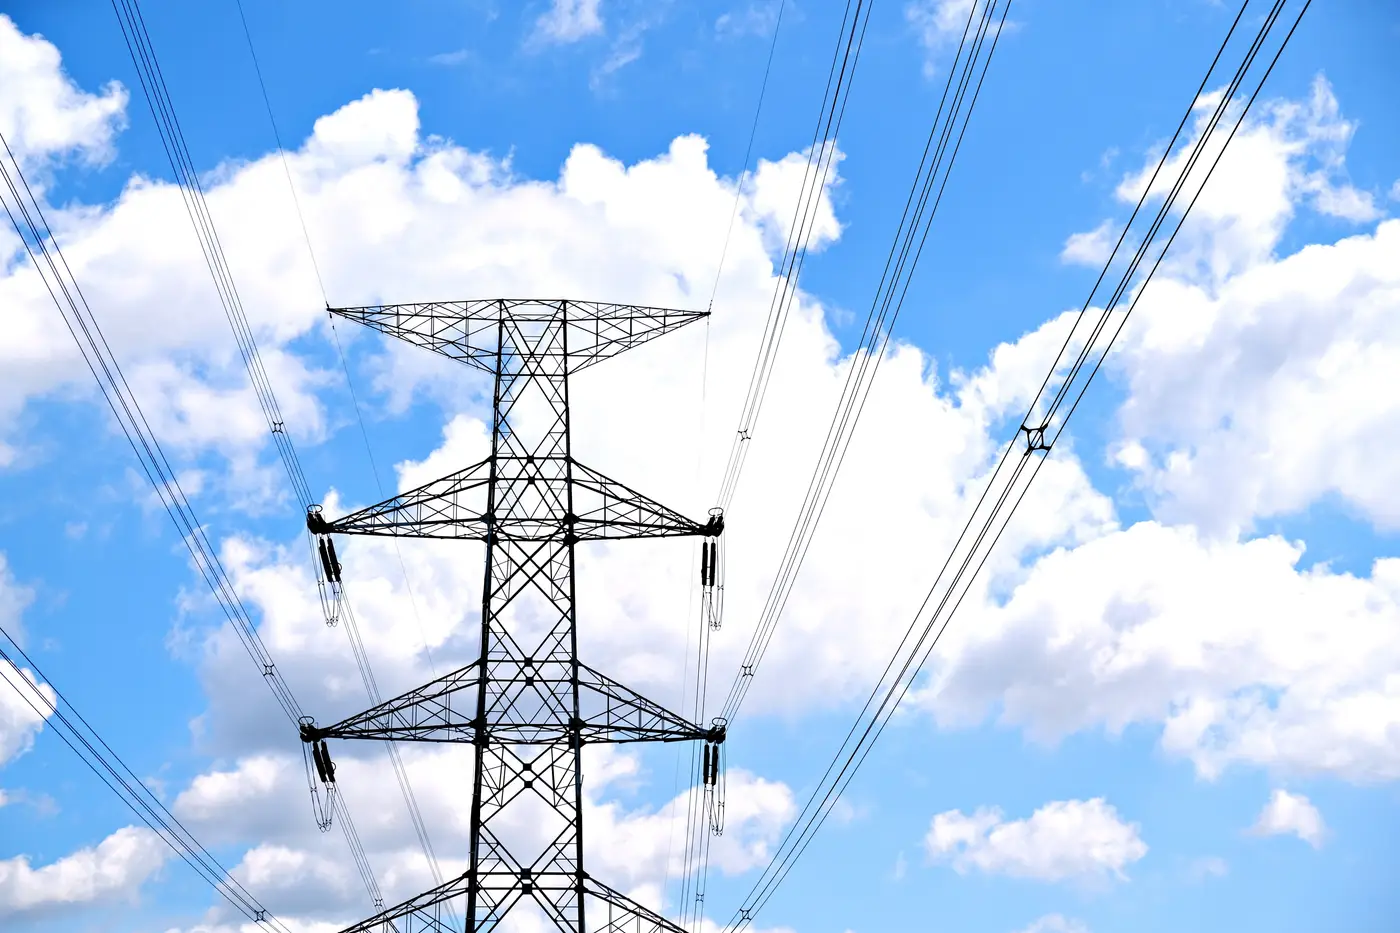
You're screening a shortlist of candidate sites and the nearest line on the utility's public GIS extract is marked simply as "132kV." No circuit count, no indication of whether it's a single run of conductor or two circuits sharing one set of structures. That distinction matters more than it looks, because a double-circuit line on the same corridor can mean more available capacity, a different connection cost assumption, and a different answer when someone asks why you picked that tie-in point over the substation two ridges over. When the GIS layer won't tell you, satellite imagery often will, if you know what you're counting.
What actually differs between the two
A single-circuit tower carries one three-phase circuit, so you're looking for three conductor attachment points (sometimes bundled, sometimes single) arranged across one tier of crossarms. The classic shapes are a horizontal crossarm with conductors in a flat line, or a delta arrangement with one conductor up top and two lower, forming a triangle when you look at the silhouette end-on.
A double-circuit tower carries two circuits on one structure, so it needs six conductor attachment points instead of three. Utilities get there in one of two common ways: a vertical "flag" configuration with two tiers of crossarms stacked one above the other, or a narrower vertical arrangement where conductors step down one side of the pole. From above, in a satellite frame, the tell is usually tower width relative to height, and whether you can resolve two distinct rows of conductor shadows running parallel instead of one.
At 0.5–2 m resolution you're not going to count individual sub-conductors inside a bundle. What you can usually resolve is the tower's crossarm structure and the number of conductor bundle shadows crossing the corridor at a consistent spacing. That's the practical ceiling for a desktop read, and it's enough to separate single-circuit from double-circuit in the large majority of cases, especially on lattice towers where the arm geometry is distinctive even at modest GSD.
A field read you can actually do on a desktop
Start at a tangent tower, not a dead-end or angle structure. Dead-ends carry extra hardware (down leads, additional insulator strings bracing the turn) that can make a single-circuit tower look busier than it is. Pick a clean run of two or three consecutive tangent towers and compare:
- Crossarm tiers. One level of arms, almost always single-circuit. Two stacked levels, almost always double-circuit.
- Conductor bundle count along the corridor. Count the parallel shadow lines crossing between two towers. Three evenly spaced lines reads as one circuit; six reads as two.
- Insulator string count at the tower. Single-circuit towers typically show three insulator strings per structure (or three bundles if suspension insulators are tight together). Double-circuit shows six, often in two visually separated groups.
- Pole vs lattice shape. Steel monopoles built for double-circuit duty tend to be visibly stockier with longer davit arms on both sides, since they're carrying twice the conductor load. A slim single-pole with short arms on one side only is a strong single-circuit signal.
None of these on their own is bulletproof. Shadow angle, sun position, and tower spacing can all distort what you're seeing, which is why cross-checking two or three consecutive structures beats reading one tower in isolation. If the corridor crosses a river or a road, the dead-end towers there often give you a cleaner, more open view than tangent towers buried in tree cover.
Why this changes your connection-distance math
A double-circuit corridor near your site doesn't guarantee anything in your favor. Sometimes the line already runs both circuits at capacity. Other times a second circuit sits de-energized, waiting for a generator to pay for the tie-in. Either way, knowing the circuit count before you call the utility changes what question you ask and how you frame the interconnection request. Guessing from a straight-line distance on a desktop map, without even knowing whether the nearest corridor is single or double, is how an early-stage screen ends up wrong by a full voltage class.
Grid Proximity Mapping builds its distance-and-route layer from the same high-resolution imagery, tracing substations and transmission corridors so each candidate site carries a real route distance instead of a ruler line across the map. If you're tired of eyeballing tower silhouettes one site at a time, that's the layer worth putting under your next screening pass.