November 2, 2026
Optical satellite imagery vs utility GIS extracts for siting substation distance
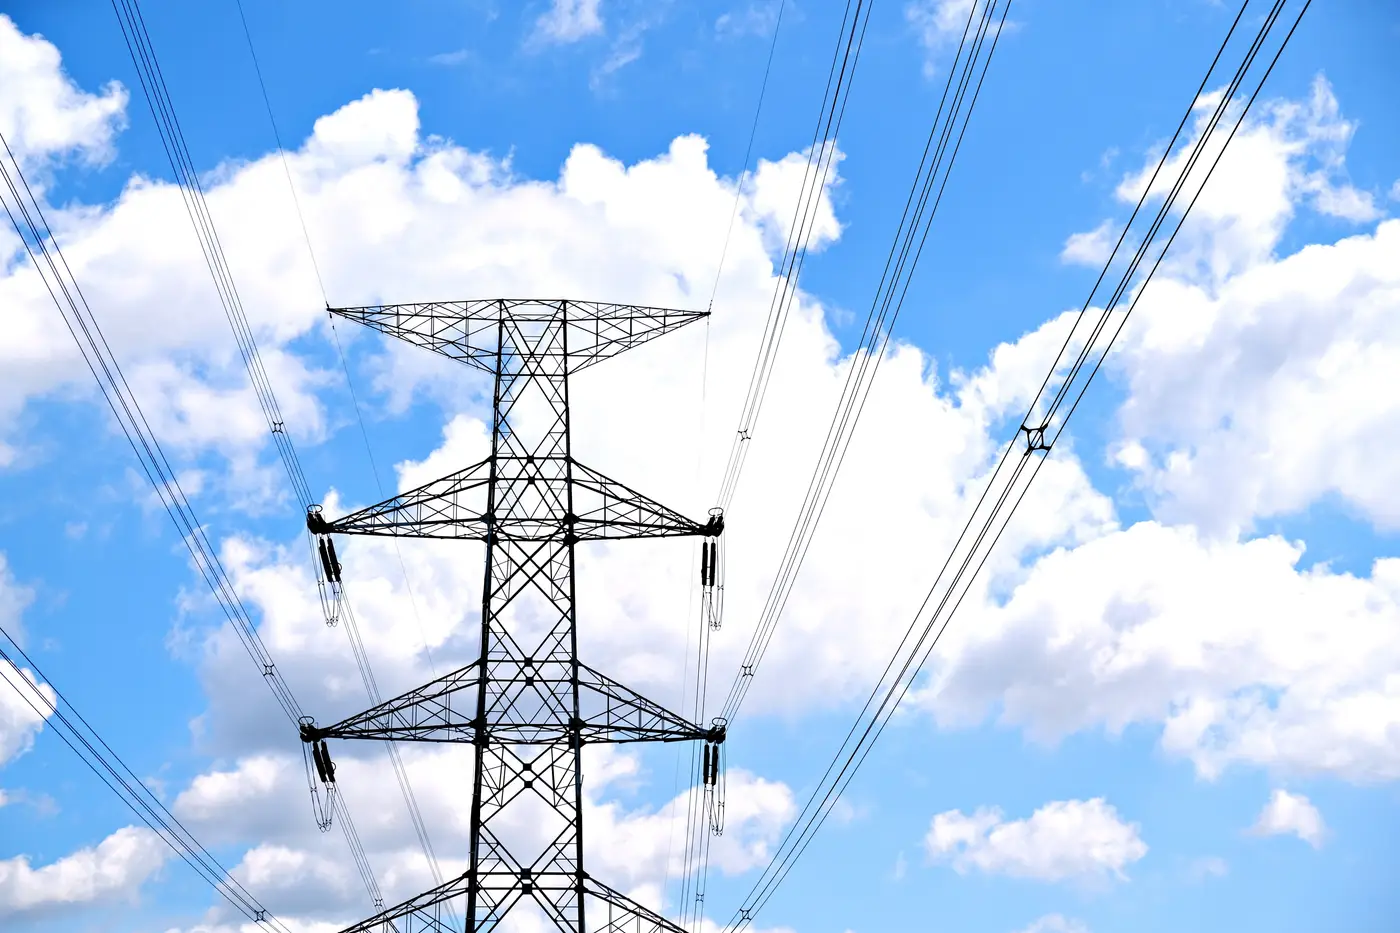
You've got a candidate site, a shapefile from the utility, and a deadline. The GIS extract shows a substation 4.2 km out. Do you trust that number enough to put it in a screening memo?
Most connections analysts have learned the hard way that the answer is usually no, or at least not without a second look.
Why the GIS extract is already out of date
Utility GIS layers get updated on the utility's schedule, not yours. A feeder gets rebuilt, a substation gets a third transformer bay added, a line gets re-routed around a new industrial park, and none of that shows up in the extract you pulled last quarter. Some utilities maintain these layers well. Others maintain them well enough for billing and fault location, which is a different bar than "accurate enough to site a 200 MW interconnection."
The other problem is coverage gaps. Extracts often stop at the edge of a utility's own territory, so a site sitting near a boundary gives you a clean picture of one side and nothing on the other. If the nearest substation happens to belong to the neighboring utility, you're back to guessing.
None of this means the extract is useless. It's still the fastest way to get a rough list of candidate points of interconnection. The issue is using it as the final distance number rather than a starting point.
What optical imagery adds
A current high-resolution optical image, something in the 0.5 to 2 meter ground sample distance range, lets you do something a GIS attribute table can't: look at the site. You can confirm the substation is still physically there, see whether it's been expanded or decommissioned, and trace the transmission corridor on the ground rather than trusting a line segment that was digitized years ago and never touched again.
This matters most for two things analysts keep running into.
Substation location verification. GIS points are sometimes placed at a parcel centroid or a meter box rather than the actual switchyard. An image lets you see the yard, the gantries, and the incoming lines, and place the point where the infrastructure sits. That shift, 150 meters here, 400 meters there, moves a site from a short tap line into a much longer build, and it's worth catching before the interconnection application goes in.
Corridor routing. A straight-line distance from candidate site to substation ignores rivers, ridgelines, protected land, and the fact that transmission lines don't fly as the crow does. Overlaying the imagery with the visible corridor, the poles and towers and the cleared right-of-way, gives you a route that bends the way the real line bends. That's a meaningfully different number for a project financing model than a ruler measurement across a desktop map.
Where this fits in a screening workflow
For early-stage screening across a portfolio of candidate sites, satellite imagery for interconnection screening works best alongside the GIS extract rather than instead of it. The extract gives you the attribute data: voltage class, owner, feeder ID. The imagery gives you ground truth: is it there, is it the size the record says, and what's the plausible path between it and your site. Analysts who skip the imagery step usually find out about the gap at the feasibility study stage, when a developer's internal estimate and the utility's quoted distance come back far enough apart to change the project economics.
The annual refresh cycle matters here too. Substations and lines don't change every week, but they do change, and a layer that's current to within the last year catches more of those changes than one built on whatever extract happened to be floating around the office.
Grid Proximity Mapping builds exactly this layer: substations, transmission lines, and their corridors mapped from current high-resolution imagery, so a candidate site carries a real connection distance and a routed path instead of a straight line and a hope. If you're tired of reconciling GIS extracts against what's on the ground, take a look at how the layer is built.